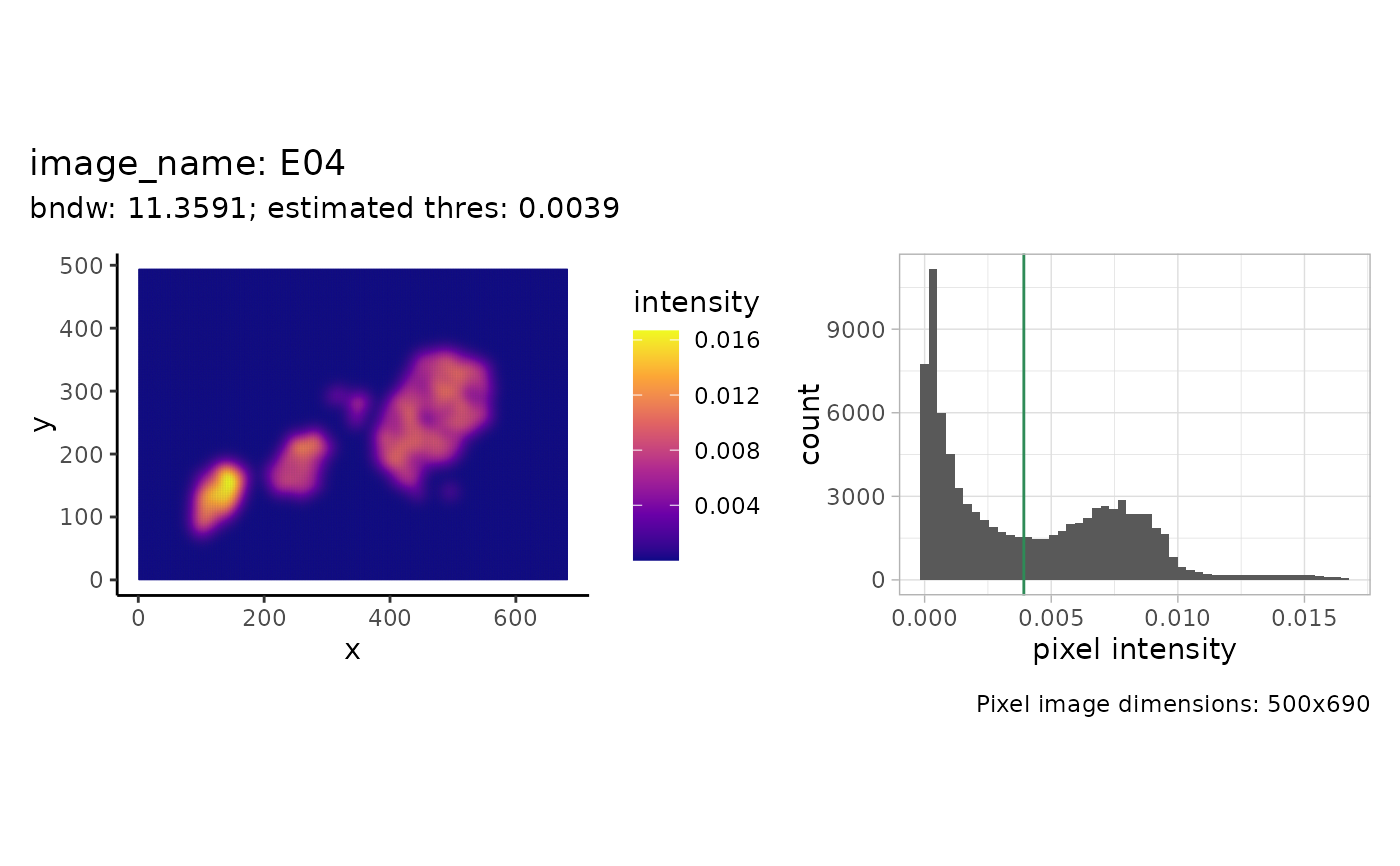
This function plots the intensity of a point pattern image and displays a histogram of the intensity values. Note that intensities less than largest intensity value divided by 250 are not displayed in the histogram.
Usage
shapeIntensityImage(
  spe,
  marks,
  imageCol = NULL,
  imageId = NULL,
  markSelect,
  bndw = NULL,
  dim = 500
)
Arguments
- spe
SpatialExperiment; a object of class
SpatialExperiment- marks
character; name of column in
colDatathat will correspond to thepppmarks- imageCol
character; name of a column in
colDatathat corresponds to the image- imageId
character; image id, must be present in imageCol
- markSelect
character; name of mark that is to be selected for the reconstruction
- bndw
numeric; smoothing bandwidth in the density estimation, corresponds to the
sigmaparameter in thedensity.pppfunction, if no value is given the bandwidth is estimated using cross validation with thebw.digglefunction.- dim
numeric; x dimension of the final reconstruction. A lower resolution speeds up computation but lead to less exact reconstruction. Default = 500
Examples
data("sostaSPE")
shapeIntensityImage(sostaSPE,
    marks = "cellType", imageCol = "imageName",
    imageId = "image1", markSelect = "A"
)