Function to assign points / coordinates to structures
Source:R/cellLevelMetrics.R
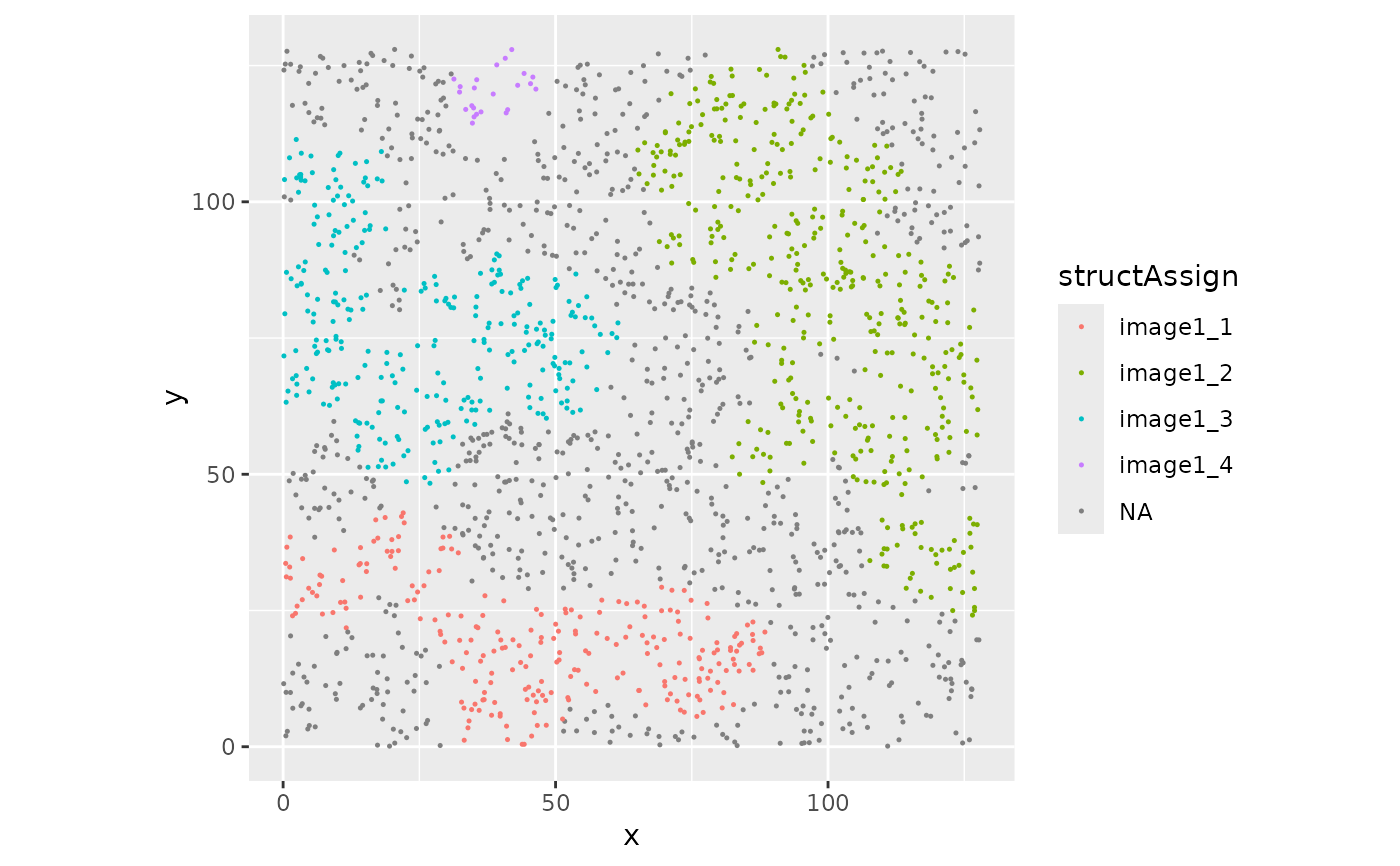
assingCellsToStructures.RdThis function assigns each spatial coordinate in a SpatialExperiment object (spe) to the first intersecting structure from a given set of spatial structures.
Usage
assingCellsToStructures(
  spe,
  allStructs,
  imageCol = NULL,
  uniqueId = "structID",
  nCores = 1
)
Arguments
- spe
SpatialExperiment; An object of class
SpatialExperimentcontaining spatial point data. Must containcolnamesfor correct assignment.- allStructs
sf; A simple feature collection (sf object) representing spatial structures. Must contain a column which contains a unique identifier for each structure. Default =
structID.- imageCol
character; The column name in
speandallStructsthat identifies the corresponding image.- uniqueId
character; The column name in the simple feature collection for which to compute the assignment.
- nCores
integer; The number of cores to use for parallel processing (default is 1).
Value
A named list with structure assignments for each spatial point in spe. Points that do not overlap with any structure are assigned NA. Names correspond to colnames of the SpatialExperiment input object.
Examples
library("SpatialExperiment")
#> Loading required package: SingleCellExperiment
#> Loading required package: SummarizedExperiment
#> Loading required package: MatrixGenerics
#> Loading required package: matrixStats
#>
#> Attaching package: ‘MatrixGenerics’
#> The following objects are masked from ‘package:matrixStats’:
#>
#>     colAlls, colAnyNAs, colAnys, colAvgsPerRowSet, colCollapse,
#>     colCounts, colCummaxs, colCummins, colCumprods, colCumsums,
#>     colDiffs, colIQRDiffs, colIQRs, colLogSumExps, colMadDiffs,
#>     colMads, colMaxs, colMeans2, colMedians, colMins, colOrderStats,
#>     colProds, colQuantiles, colRanges, colRanks, colSdDiffs, colSds,
#>     colSums2, colTabulates, colVarDiffs, colVars, colWeightedMads,
#>     colWeightedMeans, colWeightedMedians, colWeightedSds,
#>     colWeightedVars, rowAlls, rowAnyNAs, rowAnys, rowAvgsPerColSet,
#>     rowCollapse, rowCounts, rowCummaxs, rowCummins, rowCumprods,
#>     rowCumsums, rowDiffs, rowIQRDiffs, rowIQRs, rowLogSumExps,
#>     rowMadDiffs, rowMads, rowMaxs, rowMeans2, rowMedians, rowMins,
#>     rowOrderStats, rowProds, rowQuantiles, rowRanges, rowRanks,
#>     rowSdDiffs, rowSds, rowSums2, rowTabulates, rowVarDiffs, rowVars,
#>     rowWeightedMads, rowWeightedMeans, rowWeightedMedians,
#>     rowWeightedSds, rowWeightedVars
#> Loading required package: GenomicRanges
#> Loading required package: stats4
#> Loading required package: BiocGenerics
#> Loading required package: generics
#>
#> Attaching package: ‘generics’
#> The following objects are masked from ‘package:base’:
#>
#>     as.difftime, as.factor, as.ordered, intersect, is.element, setdiff,
#>     setequal, union
#>
#> Attaching package: ‘BiocGenerics’
#> The following objects are masked from ‘package:stats’:
#>
#>     IQR, mad, sd, var, xtabs
#> The following objects are masked from ‘package:base’:
#>
#>     Filter, Find, Map, Position, Reduce, anyDuplicated, aperm, append,
#>     as.data.frame, basename, cbind, colnames, dirname, do.call,
#>     duplicated, eval, evalq, get, grep, grepl, is.unsorted, lapply,
#>     mapply, match, mget, order, paste, pmax, pmax.int, pmin, pmin.int,
#>     rank, rbind, rownames, sapply, saveRDS, table, tapply, unique,
#>     unsplit, which.max, which.min
#> Loading required package: S4Vectors
#>
#> Attaching package: ‘S4Vectors’
#> The following object is masked from ‘package:utils’:
#>
#>     findMatches
#> The following objects are masked from ‘package:base’:
#>
#>     I, expand.grid, unname
#> Loading required package: IRanges
#> Loading required package: Seqinfo
#> Loading required package: Biobase
#> Welcome to Bioconductor
#>
#>     Vignettes contain introductory material; view with
#>     'browseVignettes()'. To cite Bioconductor, see
#>     'citation("Biobase")', and for packages 'citation("pkgname")'.
#>
#> Attaching package: ‘Biobase’
#> The following object is masked from ‘package:MatrixGenerics’:
#>
#>     rowMedians
#> The following objects are masked from ‘package:matrixStats’:
#>
#>     anyMissing, rowMedians
data("sostaSPE")
allStructs <- reconstructShapeDensitySPE(sostaSPE,
    marks = "cellType", imageCol = "imageName",
    markSelect = "A", bndw = 3.5, thres = 0.045
)
# The function `assingCellsToStructures` needs colnames so we create them here
colnames(sostaSPE) <- paste0("cell_", c(1:dim(sostaSPE)[2]))

res <- assingCellsToStructures(
    spe = sostaSPE, allStructs = allStructs, imageCol = "imageName"
)
# Assign the structure assignment in the order of the columns in the `SpatialExperiment` object
colData(sostaSPE)$structAssign <- res[colnames(sostaSPE)]

if (require("ggplot2")) {
    cbind(
        colData(sostaSPE[, sostaSPE[["imageName"]] == "image1"]),
        spatialCoords(sostaSPE[, sostaSPE[["imageName"]] == "image1"])
    ) |>
        as.data.frame() |>
        ggplot(aes(x = x, y = y, color = structAssign)) +
        geom_point(size = 0.25) +
        coord_equal()
}
#> Loading required package: ggplot2